Network visualization
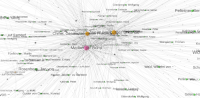
With the integration of D3.js, data can be visualized as a network graph. The graph, specific for each OpenAtlas instance, is available via the Network visualization button at the Overview or as an egocentric network at the entity detail view.
Three different layouts are provided. Classic is the default setting but it can be switched to other types at the top of the visualization pages.
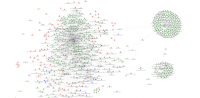
Classic
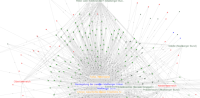
2D
3D
Options
Colors - changes the node color of classes
Depth - defines the link depth in egocentric networks
Show orphans - select if nodes without any connections are displayed
Width - define width of the displayed image in pixel
Height - define height of the displayed image in pixel
Charge - select the distance between unconnected entities
Distance - select the distance between connected entities
In case of performance issues
Check if your browser has hardware acceleration enabled
Try different browsers, some are faster than others when dealing with large data sets
Download
If an image is available (classic mode only) you can download it as PNG. Be aware that the resulting image is exactly what you see in this moment so you may want to change width and height in the options before downloading. Set the zoom level according to your needs to ensure the labels are still readable.